Executive condominiums (EC) were introduced as a hybrid between public and private housing to cater for residents who can afford more than an HDB flat but find private property to be out of their reach. In terms of design and facilities, there is no discernible difference with private condominiums. Likewise, for private condominiums, EC is developed and sold by private developers.
As new EC units are usually sold at a discount compared to nearby new private properties, EC might be a good option for genuine owner-occupied buyers who are prepared to stay for at least 5 years.
Since buying a property is usually a large personal purchase, we would examine further the past executive condominium transactions and the key consideration to purchase a new or resale executive condominium.
Market trend: Analytical comparison between Executive Condominium and Private Condominium
Executive condominiums (EC) are partially privatized after 5 years of occupation period from completion date. This means owners can sell to Singaporean citizens and permanent residents with no family nucleus requirements. After 10 years of the occupation period, owners can sell to foreigners. There will be no distinction between executive and private condominiums in terms of legal status once EC is fully privatized after 10 years.
Unlike HDB owners, executive condominiums owners have a stake in the land that they are staying on, representing a chance for owners sell their land to private developers via an En Bloc process.
The privatization status of executive condominiums in Singapore are displayed as below:
| Status | PROJECT | TENURE | COMPLETION | LOWEST PRICE* ($PSF) | AVERAGE PRICE* ($PSF) | HIGHEST PRICE* ($PSF) | LOWEST RENTAL* ($PSF PM) | AVERAGE RENTAL*($PSF PM) | HIGHEST RENTAL* ($PSF PM) |
|---|---|---|---|---|---|---|---|---|---|
| Fully privatized | EASTVALE | 99 YRS FROM 1996 | 1999 | - | - | - | 2 | 2.4 | 3.2 |
| Fully privatized | WESTMERE | 99 YRS FROM 1996 | 1999 | 847 | 878 | 911 | 2.3 | 2.7 | 3.3 |
| Fully privatized | SIMEI GREEN CONDOMINIUM | 99 YRS FROM 1996 | 1999 | 730 | 824 | 893 | 2.1 | 2.5 | 3.2 |
| Fully privatized | WINDERMERE | 99 YRS FROM 1997 | 1999 | 703 | 751 | 851 | 1.5 | 2.2 | 2.8 |
| Fully privatized | PINEVALE | 99 YRS FROM 1997 | 1999 | 735 | 780 | 859 | 1.8 | 2.2 | 2.7 |
| Fully privatized | CHESTERVALE | 99 YRS FROM 1997 | 1999 | 720 | 773 | 816 | 1 | 1.7 | 2.2 |
| Fully privatized | YEW MEI GREEN | 99 YRS FROM 1997 | 2000 | 676 | 774 | 852 | 1.7 | 2.1 | 2.6 |
| Fully privatized | THE RIVERVALE | 99 YRS FROM 1997 | 2000 | 720 | 786 | 857 | 1.4 | 2 | 2.6 |
| Fully privatized | SUMMERDALE | 99 YRS FROM 1997 | 2000 | 623 | 727 | 827 | 1.5 | 2.3 | 3.2 |
| Fully privatized | THE FLORIDA | 99 YRS FROM 1997 | 2000 | 717 | 805 | 916 | 1.9 | 2.1 | 2.6 |
| Fully privatized | NORTHOAKS | 99 YRS FROM 1997 | 2000 | 583 | 707 | 753 | 1.6 | 2.4 | 3.4 |
| Fully privatized | WOODSVALE | 99 YRS FROM 1997 | 2000 | 686 | 713 | 743 | 1.7 | 2.4 | 3.2 |
| Fully privatized | THE FLORAVALE | 99 YRS FROM 1997 | 2000 | 644 | 742 | 808 | 1.8 | 2.3 | 3 |
| Fully privatized | THE EDEN AT TAMPINES | 99 YRS FROM 2000 | 2003 | 704 | 837 | 929 | 2 | 2.4 | 3 |
| Fully privatized | THE DEW | 99 YRS FROM 2000 | 2003 | 887 | 945 | 1,027 | 2.1 | 2.4 | 2.7 |
| Fully privatized | BISHAN LOFT | 99 YRS FROM 2000 | 2003 | 1,308 | 1,321 | 1,334 | 2.6 | 3 | 3.3 |
| Fully privatized | LILYDALE | 99 YRS FROM 2000 | 2003 | 705 | 733 | 759 | 1.4 | 2.3 | 2.8 |
| Fully privatized | NUOVO | 99 YRS FROM 2001 | 2004 | 938 | 1,022 | 1,129 | 2 | 2.4 | 3.2 |
| Fully privatized | PARK GREEN | 99 YRS FROM 2001 | 2004 | 781 | 885 | 949 | 1.7 | 2.2 | 3 |
| Fully privatized | THE ESPARIS | 99 YRS FROM 2002 | 2005 | 755 | 796 | 836 | 2 | 2.5 | 3 |
| Fully privatized | WHITEWATER | 99 YRS FROM 2002 | 2005 | 755 | 851 | 920 | 2 | 2.3 | 2.9 |
| Fully privatized | THE QUINTET | 99 YRS FROM 2003 | 2006 | 694 | 805 | 860 | 1.9 | 2.3 | 3.2 |
| Fully privatized | LA CASA | 99 YRS FROM 2004 | 2008 | 758 | 811 | 906 | 2 | 2.4 | 3.4 |
| Partially privatized | ESPARINA RESIDENCES | 99 YRS FROM 2010 | 2013 | 1,121 | 1,196 | 1,289 | 2.7 | 3.1 | 3.5 |
| Partially privatized | PRIVE | 99 YRS FROM 2010 | 2013 | 832 | 1,094 | 1,261 | 1.2 | 3 | 3.6 |
| Partially privatized | THE CANOPY | 99 YRS FROM 2010 | 2014 | 729 | 866 | 938 | 2.3 | 2.7 | 2.9 |
| Partially privatized | AUSTVILLE RESIDENCES | 99 YRS FROM 2010 | 2014 | 910 | 993 | 1,082 | 2.4 | 2.9 | 3.7 |
| Partially privatized | BELYSA | 99 YRS FROM 2011 | 2014 | 948 | 979 | 1,031 | 1.7 | 3.1 | 3.8 |
| Partially privatized | RIVERPARC RESIDENCE | 99 YRS FROM 2010 | 2014 | 732 | 941 | 1,066 | 1.4 | 2.2 | 3 |
| Partially privatized | BLOSSOM RESIDENCES | 99 YRS FROM 2011 | 2014 | 948 | 983 | 1,003 | 1.9 | 2.6 | 3.3 |
| Partially privatized | ARC AT TAMPINES | 99 YRS FROM 2011 | 2014 | 794 | 969 | 1,062 | 1.3 | 3.1 | 3.9 |
| Partially privatized | WATERCOLOURS | 99 YRS FROM 2012 | 2014 | 749 | 883 | 966 | 1.4 | 2.8 | 3.7 |
| Partially privatized | THE TAMPINES TRILLIANT | 99 YRS FROM 2011 | 2015 | 953 | 1,180 | 1,314 | 1.9 | 3.2 | 4.1 |
| Partially privatized | THE RAINFOREST | 99 YRS FROM 2011 | 2015 | 950 | 1,134 | 1,247 | 2.6 | 2.8 | 2.9 |
| Partially privatized | TWIN WATERFALLS | 99 YRS FROM 2011 | 2015 | 823 | 1,055 | 1,155 | 1.5 | 2.8 | 3.3 |
| Partially privatized | 1 CANBERRA | 99 YRS FROM 2012 | 2015 | 841 | 991 | 1,111 | 1.2 | 2.3 | 3.4 |
| Partially privatized | HERON BAY | 99 YRS FROM 2012 | 2015 | 825 | 973 | 1,101 | 1.3 | 2.5 | 3.6 |
| Partially privatized | WATERWOODS | 99 YRS FROM 2013 | 2015 | 937 | 1,051 | 1,130 | 2.8 | 2.8 | 2.8 |
| Partially privatized | WATERBAY | 99 YRS FROM 2012 | 2016 | 768 | 1,049 | 1,148 | 1.3 | 2.7 | 3.4 |
| Partially privatized | THE TOPIARY | 99 YRS FROM 2012 | 2016 | 972 | 1,100 | 1,202 | 1.2 | 3.1 | 4.3 |
| Partially privatized | CITYLIFE@TAMPINES | 99 YRS FROM 2012 | 2016 | 667 | 1,087 | 1,230 | 1.2 | 2.8 | 3.6 |
| Partially privatized | TWIN FOUNTAINS | 99 YRS FROM 2012 | 2016 | 791 | 964 | 1,027 | 1.3 | 2.6 | 3.6 |
| Partially privatized | FORESTVILLE | 99 YRS FROM 2012 | 2016 | 812 | 959 | 1,065 | 1 | 2.8 | 3.7 |
| Partially privatized | LUSH ACRES | 99 YRS FROM 2013 | 2016 | 991 | 1101 | 1,204 | 2.3 | 2.9 | 3.5 |
| Partially privatized | ECOPOLITAN | 99 YRS FROM 2012 | 2016 | 951 | 1082 | 1,208 | 2.4 | 2.9 | 3.2 |
| Partially privatized | SEA HORIZON | 99 YRS FROM 2013 | 2016 | 933 | 1030 | 1,205 | 2.4 | 2.8 | 3.3 |
| Partially privatized | SKYPARK RESIDENCES | 99 YRS FROM 2013 | 2016 | 923 | 1081 | 1,202 | 2.6 | 2.8 | 3.1 |
| Partially privatized | LAKE LIFE | 99 YRS FROM 2013 | 2016 | 1041 | 1140 | 1,214 | 2.5 | 2.9 | 3.5 |
| Partially privatized | THE AMORE | 99 YRS FROM 2013 | 2016 | 937 | 1081 | 1,258 | 3.4 | 3.4 | 3.4 |
| First 5 years | BELLEWOODS | 99 YRS FROM 2013 | 2017 | 974 | 979 | 986 | - | - | - |
| First 5 years | BELLEWATERS | 99 YRS FROM 2013 | 2017 | 1,026 | 1,045 | 1,069 | 3.7 | 3.7 | 3.7 |
| First 5 years | THE TERRACE | 99 YRS FROM 2013 | 2017 | - | - | - | 2.4 | 2.4 | 2.4 |
| First 5 years | WESTWOOD RESIDENCES | 99 YEARS LEASEHOLD | 2017 | - | - | - | 2.4 | 3.5 | 3.9 |
| First 5 years | THE VALES | 99 YEARS LEASEHOLD | 2017 | 1,000 | 1,042 | 1,098 | 2.5 | 3.1 | 3.6 |
| First 5 years | THE BROWNSTONE | 99 YEARS LEASEHOLD | 2017 | 1,035 | 1,081 | 1,127 | - | - | - |
| First 5 years | SIGNATURE AT YISHUN | 99 YEARS LEASEHOLD | 2017 | 927 | 959 | 1,019 | 2.7 | 2.7 | 2.7 |
| First 5 years | SOL ACRES | 99 YEARS LEASEHOLD | 2018 | 1,023 | 1,101 | 1,209 | 3 | 3.4 | 3.6 |
| First 5 years | THE CRITERION | 99 YEARS LEASEHOLD | 2018 | 972 | 989 | 1,006 | - | - | - |
| First 5 years | WANDERVALE | 99 YEARS LEASEHOLD | 2018 | - | - | - | 2.4 | 2.9 | 3.4 |
| First 5 years | THE VISIONAIRE | 99 YEARS LEASEHOLD | 2018 | - | - | - | 3.5 | 3.5 | 3.5 |
| First 5 years | PARC LIFE | 99 YEARS LEASEHOLD | 2018 | 967 | 1,024 | 1,056 | 3 | 3.1 | 3.2 |
| First 5 years | TREASURE CREST | 99 YEARS LEASEHOLD | 2018 | 1,076 | 1,110 | 1,143 | - | - | - |
| First 5 years | NORTHWAVE | 99 YEARS LEASEHOLD | 2019 | 857 | 948 | 1,011 | - | - | - |
| First 5 years | INZ RESIDENCE | 99 YEARS LEASEHOLD | 2019 | - | - | - | - | - | - |
| First 5 years | HUNDRED PALMS RESIDENCES | 99 YEARS LEASEHOLD | 2019 | - | - | - | 3.2 | 3.2 | 3.2 |
| First 5 years | RIVERCOVE RESIDENCES | 99 YEARS LEASEHOLD | 2020 | 1,190 | 1,197 | 1,203 | - | - | - |
| Uncompleted | PIERMONT GRAND | 99 YEARS LEASEHOLD | UNCOMPLETED | 1,098 | 1,165 | 1,300 | - | - | - |
| Uncompleted | PARC CANBERRA | 99 YEARS LEASEHOLD | UNCOMPLETED | 1,083 | 1,083 | 1,083 | - | - | - |
| Uncompleted | OLA | 99 YEARS LEASEHOLD | UNCOMPLETED | 1,038 | 1,171 | 1,357 | - | - | - |
| Uncompleted | PARC CENTRAL RESIDENCES | 99 YEARS LEASEHOLD | UNCOMPLETED | 1,066 | 1,209 | 1,281 | - | - | - |
| Uncompleted | PROVENCE RESIDENCE | 99 YEARS LEASEHOLD | UNCOMPLETED | 1,047 | 1,211 | 1,327 | - | - | - |
| Uncompleted | PARC GREENWICH | 99 YEARS LEASEHOLD | UNCOMPLETED | 1,029 | 1,227 | 1,379 | - | - | - |
| Uncompleted | NORTH GAIA | 99 YEARS LEASEHOLD | UNCOMPLETED | TBC | TBC | TBC | - | - | - |
With a lower entry price, Executive Condominium easily represents a greater potential for appreciation. Using the recent eligible executive condominiums that have met the Minimum Occupation Period as case study, there is a significant capital gain of more than 20% gain over the initial purchase price.
| Project | Launch Period | TOP Date | Average Purchase Price | Average Transacted Price | Percentage Gain |
|---|---|---|---|---|---|
| Esparina Residences | 10-Oct | 11-Sep-13 | $754 | $1,095 | 45% |
| The Canopy | 10-Nov | 14-Jan-14 | $652 | $820 | 26% |
| Prive | 11-Jan | 17-Jul-13 | $686 | $972 | 42% |
| Austville Residences | 11-Feb | 22-Apr-14 | $700 | $890 | 27% |
| Arc At Tampines | 11-Oct | 5-Aug-14 | $744 | $917 | 23% |
| Blossom Residences | 11-Jul | 5-Sep-14 | $700 | $881 | 26% |
| Riverparc Residence | 11-Jul | 19-Jun-14 | $678 | $872 | 29% |
| Belysa | 11-Jun | 28-May-14 | $669 | $856 | 28% |
| The Tampines Trilliant | 12-Feb | 6-Feb-15 | $800 | $1,051 | 31% |
Esparina Residences Transaction
| SOLD ON | ADDRESS | UNIT AREA (SQFT) | SALE PRICE (S$ PSF) | BOUGHT ON | PURCHASE PRICE (S$ PSF) | PROFIT (S$) | HOLDING PERIOD (DAYS) | ANNUALISED (%) | |||||||
|---|---|---|---|---|---|---|---|---|---|---|---|---|---|---|---|
| 12 | AUG | 2021 | 123 | COMPASSVALE | BOW | #XX-26 | 1,776 | 940 | 9 | DEC | 2010 | 562 | 670,888 | 3,899 | 4.9 |
| 10 | OCT | 2018 | 117 | COMPASSVALE | BOW | #XX-16 | 1,830 | 994 | 29 | NOV | 2010 | 638 | 651,000 | 2,872 | 5.8 |
| 29 | APR | 2021 | 117 | COMPASSVALE | BOW | #XX-15 | 1,399 | 1,143 | 28 | DEC | 2010 | 687 | 639,000 | 3,775 | 5.1 |
| 4 | DEC | 2020 | 123 | COMPASSVALE | BOW | #XX-27 | 1,679 | 923 | 14 | DEC | 2010 | 544 | 636,000 | 3,643 | 5.4 |
| 22 | JUL | 2021 | 123 | COMPASSVALE | BOW | #XX-28 | 1,776 | 901 | 23 | DEC | 2010 | 544 | 634,000 | 3,864 | 4.9 |
| 9 | APR | 2021 | 117 | COMPASSVALE | BOW | #XX-16 | 1,464 | 1,182 | 25 | NOV | 2010 | 769 | 604,888 | 3,788 | 4.2 |
| 7 | FEB | 2022 | 123 | COMPASSVALE | BOW | #XX-27 | 1,001 | 1,309 | 2 | DEC | 2010 | 726 | 583,000 | 4,085 | 5.4 |
| 15 | MAR | 2021 | 121 | COMPASSVALE | BOW | #XX-21 | 1,367 | 1,170 | 10 | DEC | 2010 | 759 | 563,000 | 3,748 | 4.3 |
| 12 | AUG | 2020 | 117 | COMPASSVALE | BOW | #XX-16 | 1,464 | 1,134 | 22 | NOV | 2010 | 751 | 560,000 | 3,551 | 4.3 |
| 18 | SEP | 2020 | 117 | COMPASSVALE | BOW | #XX-16 | 1,464 | 1,141 | 2 | FEB | 2011 | 761 | 556,000 | 3,516 | 4.3 |
| 28 | MAR | 2019 | 115 | COMPASSVALE | BOW | #XX-11 | 1,679 | 869 | 19 | NOV | 2010 | 546 | 544,000 | 3,051 | 5.7 |
| 24 | JUL | 2020 | 117 | COMPASSVALE | BOW | #XX-16 | 1,464 | 1,112 | 17 | MAR | 2011 | 741 | 543,000 | 3,417 | 4.4 |
| 21 | OCT | 2021 | 115 | COMPASSVALE | BOW | #XX-11 | 1,001 | 1,279 | 3 | DEC | 2010 | 741 | 538,000 | 3,975 | 5.1 |
| 29 | OCT | 2021 | 115 | COMPASSVALE | BOW | #XX-09 | 1,066 | 1,265 | 9 | DEC | 2010 | 765 | 533,000 | 3,977 | 4.7 |
| 23 | JUL | 2019 | 117 | COMPASSVALE | BOW | #XX-16 | 1,464 | 1,120 | 5 | JAN | 2011 | 758 | 529,888 | 3,121 | 4.7 |
| 8 | APR | 2019 | 121 | COMPASSVALE | BOW | #XX-21 | 1,367 | 1,167 | 1 | NOV | 2010 | 785 | 522,000 | 3,080 | 4.8 |
| 3 | JUL | 2020 | 121 | COMPASSVALE | BOW | #XX-22 | 1,367 | 1,170 | 17 | JAN | 2011 | 791 | 518,000 | 3,455 | 4.2 |
| 12 | JUL | 2021 | 115 | COMPASSVALE | BOW | #XX-12 | 1,066 | 1,246 | 11 | NOV | 2010 | 761 | 517,000 | 3,896 | 4.7 |
| 14 | DEC | 2018 | 127 | COMPASSVALE | BOW | #XX-32 | 1,249 | 1,048 | 19 | JAN | 2011 | 636 | 514,000 | 2,886 | 6.5 |
| 27 | SEP | 2018 | 115 | COMPASSVALE | BOW | #XX-09 | 1,776 | 836 | 27 | DEC | 2010 | 549 | 510,000 | 2,831 | 5.6 |
| 19 | NOV | 2021 | 125 | COMPASSVALE | BOW | #XX-31 | 1,001 | 1,245 | 11 | JAN | 2011 | 737 | 508,000 | 3,965 | 4.9 |
| 13 | AUG | 2021 | 119 | COMPASSVALE | BOW | #XX-18 | 1,001 | 1,237 | 26 | NOV | 2010 | 729 | 508,000 | 3,913 | 5.1 |
| 30 | MAR | 2020 | 121 | COMPASSVALE | BOW | #XX-22 | 2,583 | 700 | 29 | NOV | 2010 | 503 | 508,000 | 3,409 | 3.6 |
| 27 | FEB | 2019 | 121 | COMPASSVALE | BOW | #XX-21 | 1,367 | 1,141 | 8 | FEB | 2011 | 779 | 495,000 | 2,941 | 4.9 |
| 6 | DEC | 2019 | 119 | COMPASSVALE | BOW | #XX-17 | 1,066 | 1,182 | 13 | DEC | 2010 | 724 | 489,000 | 3,280 | 5.6 |
| 2 | OCT | 2019 | 123 | COMPASSVALE | BOW | #XX-28 | 1,066 | 1,173 | 6 | DEC | 2010 | 714 | 489,000 | 3,222 | 5.8 |
| 4 | MAR | 2020 | 127 | COMPASSVALE | BOW | #XX-33 | 1,292 | 1,006 | 26 | NOV | 2010 | 630 | 486,000 | 3,386 | 5.2 |
| 8 | JUL | 2019 | 125 | COMPASSVALE | BOW | #XX-31 | 1,001 | 1,249 | 13 | DEC | 2010 | 766 | 483,000 | 3,129 | 5.9 |
| 26 | APR | 2021 | 123 | COMPASSVALE | BOW | #XX-26 | 1,066 | 1,217 | 8 | DEC | 2010 | 765 | 481,888 | 3,792 | 4.6 |
| 23 | JUL | 2021 | 125 | COMPASSVALE | BOW | #XX-31 | 1,001 | 1,238 | 14 | DEC | 2010 | 763 | 475,000 | 3,874 | 4.7 |
| 27 | OCT | 2020 | 119 | COMPASSVALE | BOW | #XX-17 | 1,066 | 1,153 | 8 | DEC | 2010 | 717 | 464,800 | 3,611 | 4.9 |
| 19 | NOV | 2019 | 119 | COMPASSVALE | BOW | #XX-17 | 1,066 | 1,164 | 29 | NOV | 2010 | 728 | 464,000 | 3,277 | 5.4 |
| 19 | MAR | 2019 | 117 | COMPASSVALE | BOW | #XX-13 | 1,432 | 990 | 13 | JAN | 2011 | 668 | 460,000 | 2,987 | 4.9 |
| 7 | JAN | 2021 | 115 | COMPASSVALE | BOW | #XX-09 | 1,066 | 1,201 | 6 | DEC | 2010 | 770 | 459,000 | 3,685 | 4.5 |
| 14 | JAN | 2019 | 111 | COMPASSVALE | BOW | #XX-04 | 1,055 | 1,066 | 20 | DEC | 2010 | 636 | 454,000 | 2,947 | 6.6 |
| 5 | DEC | 2018 | 125 | COMPASSVALE | BOW | #XX-31 | 1,249 | 1,001 | 3 | DEC | 2010 | 639 | 452,000 | 2,924 | 5.8 |
| 1 | APR | 2021 | 119 | COMPASSVALE | BOW | #XX-20 | 1,356 | 983 | 15 | NOV | 2010 | 651 | 450,000 | 3,790 | 4 |
| 19 | OCT | 2020 | 117 | COMPASSVALE | BOW | #XX-15 | 1,163 | 1,161 | 26 | NOV | 2010 | 777 | 447,000 | 3,615 | 4.1 |
| 25 | JUL | 2019 | 117 | COMPASSVALE | BOW | #XX-15 | 1,163 | 1,127 | 19 | NOV | 2010 | 749 | 439,000 | 3,170 | 4.8 |
| 18 | OCT | 2019 | 115 | COMPASSVALE | BOW | #XX-12 | 1,066 | 1,162 | 29 | NOV | 2010 | 752 | 437,000 | 3,245 | 5 |
| 12 | NOV | 2020 | 123 | COMPASSVALE | BOW | #XX-26 | 1,066 | 1,182 | 8 | DEC | 2010 | 773 | 436,000 | 3,627 | 4.4 |
| 5 | AUG | 2021 | 127 | COMPASSVALE | BOW | #XX-32 | 1,001 | 1,199 | 7 | JAN | 2011 | 765 | 434,000 | 3,863 | 4.3 |
| 29 | MAR | 2021 | 119 | COMPASSVALE | BOW | #XX-19 | 1,001 | 1,219 | 26 | NOV | 2010 | 787 | 432,000 | 3,776 | 4.3 |
| 20 | NOV | 2020 | 113 | COMPASSVALE | BOW | #XX-07 | 1,066 | 1,182 | 29 | NOV | 2010 | 778 | 431,000 | 3,644 | 4.3 |
| 22 | MAR | 2019 | 117 | COMPASSVALE | BOW | #XX-14 | 1,163 | 1,118 | 3 | DEC | 2010 | 749 | 429,000 | 3,031 | 4.9 |
| 16 | SEP | 2020 | 117 | COMPASSVALE | BOW | #XX-13 | 1,163 | 1,170 | 27 | DEC | 2010 | 802 | 428,000 | 3,551 | 4 |
| 28 | AUG | 2019 | 123 | COMPASSVALE | BOW | #XX-25 | 1,066 | 1,159 | 12 | NOV | 2010 | 759 | 426,000 | 3,211 | 4.9 |
| 21 | APR | 2021 | 119 | COMPASSVALE | BOW | #XX-19 | 1,001 | 1,214 | 22 | NOV | 2010 | 790 | 424,000 | 3,803 | 4.2 |
| 13 | JUN | 2019 | 117 | COMPASSVALE | BOW | #XX-14 | 1,163 | 1,144 | 10 | JAN | 2011 | 780 | 423,000 | 3,076 | 4.6 |
| 28 | SEP | 2020 | 117 | COMPASSVALE | BOW | #XX-15 | 1,163 | 1,118 | 7 | DEC | 2010 | 759 | 418,000 | 3,583 | 4 |
| 21 | OCT | 2019 | 115 | COMPASSVALE | BOW | #XX-09 | 1,066 | 1,126 | 6 | JAN | 2011 | 734 | 418,000 | 3,210 | 5 |
| 5 | NOV | 2019 | 117 | COMPASSVALE | BOW | #XX-13 | 1,163 | 1,153 | 22 | NOV | 2010 | 794 | 417,888 | 3,270 | 4.3 |
| 11 | AUG | 2020 | 117 | COMPASSVALE | BOW | #XX-15 | 1,163 | 1,118 | 19 | NOV | 2010 | 761 | 415,000 | 3,553 | 4 |
| 23 | SEP | 2019 | 123 | COMPASSVALE | BOW | #XX-28 | 1,066 | 1,107 | 2 | DEC | 2010 | 718 | 415,000 | 3,217 | 5 |
| 30 | MAR | 2021 | 117 | COMPASSVALE | BOW | #XX-14 | 1,163 | 1,123 | 19 | NOV | 2010 | 770 | 410,000 | 3,784 | 3.7 |
| 13 | SEP | 2019 | 123 | COMPASSVALE | BOW | #XX-28 | 1,066 | 1,140 | 7 | DEC | 2010 | 755 | 410,000 | 3,202 | 4.8 |
| 21 | JUN | 2019 | 119 | COMPASSVALE | BOW | #XX-18 | 1,001 | 1,128 | 23 | NOV | 2010 | 720 | 407,888 | 3,132 | 5.4 |
| 26 | JUN | 2019 | 127 | COMPASSVALE | BOW | #XX-32 | 1,001 | 1,174 | 2 | DEC | 2010 | 769 | 405,000 | 3,128 | 5.1 |
| 5 | OCT | 2020 | 117 | COMPASSVALE | BOW | #XX-14 | 1,163 | 1,153 | 9 | MAR | 2012 | 805 | 404,000 | 3,132 | 4.3 |
| 22 | APR | 2021 | 127 | COMPASSVALE | BOW | #XX-33 | 1,001 | 1,159 | 26 | NOV | 2010 | 757 | 402,000 | 3,800 | 4.2 |
| 28 | DEC | 2018 | 117 | COMPASSVALE | BOW | #XX-13 | 1,163 | 1,144 | 18 | NOV | 2010 | 799 | 401,000 | 2,962 | 4.5 |
| 7 | SEP | 2020 | 117 | COMPASSVALE | BOW | #XX-14 | 1,163 | 1,127 | 30 | NOV | 2010 | 783 | 400,000 | 3,569 | 3.8 |
| 8 | NOV | 2018 | 117 | COMPASSVALE | BOW | #XX-15 | 1,163 | 1,108 | 2 | DEC | 2010 | 764 | 400,000 | 2,898 | 4.8 |
| 5 | NOV | 2019 | 127 | COMPASSVALE | BOW | #XX-33 | 1,001 | 1,129 | 19 | NOV | 2010 | 730 | 399,000 | 3,273 | 5 |
| 22 | MAY | 2019 | 127 | COMPASSVALE | BOW | #XX-33 | 1,001 | 1,164 | 19 | NOV | 2010 | 766 | 398,000 | 3,106 | 5 |
| 15 | SEP | 2020 | 113 | COMPASSVALE | BOW | #XX-07 | 1,066 | 1,159 | 6 | DEC | 2010 | 786 | 397,000 | 3,571 | 4 |
| 22 | MAR | 2021 | 127 | COMPASSVALE | BOW | #XX-33 | 1,001 | 1,129 | 18 | JAN | 2011 | 734 | 395,000 | 3,716 | 4.3 |
| 26 | APR | 2019 | 119 | COMPASSVALE | BOW | #XX-19 | 1,001 | 1,197 | 20 | DEC | 2010 | 802 | 395,000 | 3,049 | 4.9 |
| 23 | APR | 2019 | 123 | COMPASSVALE | BOW | #XX-28 | 1,066 | 1,107 | 16 | NOV | 2010 | 737 | 395,000 | 3,080 | 4.9 |
| 14 | NOV | 2018 | 125 | COMPASSVALE | BOW | #XX-30 | 1,292 | 945 | 14 | JAN | 2011 | 639 | 394,000 | 2,861 | 5.1 |
| 14 | MAY | 2019 | 123 | COMPASSVALE | BOW | #XX-27 | 1,001 | 1,099 | 28 | DEC | 2010 | 706 | 393,000 | 3,059 | 5.4 |
| 20 | JUL | 2020 | 119 | COMPASSVALE | BOW | #XX-20 | 1,066 | 1,162 | 26 | NOV | 2010 | 795 | 391,000 | 3,524 | 4 |
| 20 | SEP | 2018 | 123 | COMPASSVALE | BOW | #XX-28 | 1,066 | 1,107 | 7 | DEC | 2010 | 740 | 391,000 | 2,844 | 5.3 |
| 22 | SEP | 2020 | 115 | COMPASSVALE | BOW | #XX-10 | 1,066 | 1,107 | 2 | DEC | 2010 | 744 | 387,000 | 3,582 | 4.1 |
| 26 | MAR | 2019 | 123 | COMPASSVALE | BOW | #XX-27 | 1,001 | 1,149 | 24 | NOV | 2010 | 762 | 387,000 | 3,044 | 5 |
| 10 | JUL | 2019 | 119 | COMPASSVALE | BOW | #XX-18 | 1,001 | 1,099 | 29 | NOV | 2010 | 713 | 386,000 | 3,145 | 5.1 |
| 13 | MAY | 2019 | 125 | COMPASSVALE | BOW | #XX-31 | 1,001 | 1,119 | 28 | MAR | 2011 | 733 | 386,000 | 2,968 | 5.3 |
| 7 | DEC | 2018 | 119 | COMPASSVALE | BOW | #XX-20 | 1,066 | 1,126 | 15 | NOV | 2010 | 765 | 385,000 | 2,944 | 4.9 |
| 2 | MAY | 2019 | 119 | COMPASSVALE | BOW | #XX-18 | 1,001 | 1,159 | 30 | NOV | 2010 | 775 | 384,000 | 3,075 | 4.9 |
| 6 | AUG | 2019 | 113 | COMPASSVALE | BOW | #XX-08 | 1,066 | 1,154 | 30 | NOV | 2010 | 798 | 380,000 | 3,171 | 4.3 |
| 3 | AUG | 2019 | 115 | COMPASSVALE | BOW | #XX-09 | 1,066 | 1,079 | 13 | DEC | 2010 | 723 | 380,000 | 3,155 | 4.7 |
| 27 | MAR | 2019 | 123 | COMPASSVALE | BOW | #XX-27 | 1,001 | 1,099 | 17 | DEC | 2010 | 722 | 377,000 | 3,022 | 5.2 |
| 14 | DEC | 2018 | 117 | COMPASSVALE | BOW | #XX-15 | 1,163 | 1,067 | 8 | DEC | 2010 | 742 | 377,000 | 2,928 | 4.6 |
| 24 | SEP | 2018 | 121 | COMPASSVALE | BOW | #XX-22 | 1,367 | 1,061 | 8 | OCT | 2010 | 785 | 377,000 | 2,908 | 3.9 |
| 19 | SEP | 2018 | 115 | COMPASSVALE | BOW | #XX-10 | 1,066 | 1,107 | 8 | NOV | 2010 | 754 | 377,000 | 2,872 | 5 |
| 19 | OCT | 2018 | 115 | COMPASSVALE | BOW | #XX-09 | 1,066 | 1,107 | 2 | DEC | 2010 | 756 | 374,000 | 2,878 | 5 |
| 5 | NOV | 2019 | 127 | COMPASSVALE | BOW | #XX-33 | 1,001 | 1,109 | 25 | NOV | 2010 | 738 | 371,000 | 3,267 | 4.6 |
| 8 | MAR | 2019 | 113 | COMPASSVALE | BOW | #XX-08 | 1,066 | 1,112 | 25 | NOV | 2010 | 764 | 371,000 | 3,025 | 4.6 |
| 16 | NOV | 2018 | 117 | COMPASSVALE | BOW | #XX-13 | 1,163 | 1,105 | 29 | NOV | 2010 | 786 | 371,000 | 2,909 | 4.4 |
| 12 | NOV | 2018 | 119 | COMPASSVALE | BOW | #XX-19 | 1,001 | 1,179 | 18 | MAR | 2011 | 808 | 371,000 | 2,796 | 5.1 |
| 7 | DEC | 2018 | 123 | COMPASSVALE | BOW | #XX-26 | 1,066 | 1,126 | 1 | DEC | 2010 | 779 | 370,000 | 2,928 | 4.7 |
| 21 | SEP | 2018 | 119 | COMPASSVALE | BOW | #XX-18 | 1,001 | 1,079 | 19 | NOV | 2010 | 709 | 370,000 | 2,863 | 5.5 |
| 28 | AUG | 2020 | 127 | COMPASSVALE | BOW | #XX-32 | 1,001 | 1,099 | 29 | NOV | 2010 | 730 | 369,000 | 3,560 | 4.3 |
| 27 | JUN | 2019 | 113 | COMPASSVALE | BOW | #XX-07 | 1,066 | 1,143 | 26 | NOV | 2010 | 798 | 368,000 | 3,135 | 4.3 |
| 1 | APR | 2020 | 115 | COMPASSVALE | BOW | #XX-11 | 1,001 | 1,089 | 29 | NOV | 2010 | 723 | 366,000 | 3,411 | 4.5 |
| 31 | MAY | 2019 | 115 | COMPASSVALE | BOW | #XX-11 | 1,001 | 1,099 | 30 | NOV | 2010 | 736 | 363,000 | 3,104 | 4.8 |
| 27 | AUG | 2020 | 125 | COMPASSVALE | BOW | #XX-30 | 1,001 | 1,149 | 10 | MAR | 2011 | 788 | 361,000 | 3,458 | 4.1 |
| 18 | JAN | 2019 | 119 | COMPASSVALE | BOW | #XX-18 | 1,001 | 1,119 | 20 | APR | 2011 | 758 | 361,000 | 2,830 | 5.1 |
| 6 | SEP | 2021 | 123 | COMPASSVALE | BOW | #XX-27 | 1,001 | 1,240 | 11 | JAN | 2018 | 879 | 360,888 | 1,334 | 9.9 |
| 10 | OCT | 2019 | 123 | COMPASSVALE | BOW | #XX-26 | 1,066 | 1,079 | 23 | NOV | 2010 | 743 | 358,000 | 3,243 | 4.3 |
| 12 | OCT | 2018 | 113 | COMPASSVALE | BOW | #XX-08 | 1,066 | 1,135 | 25 | NOV | 2010 | 800 | 357,000 | 2,878 | 4.5 |
| 23 | JAN | 2019 | 123 | COMPASSVALE | BOW | #XX-26 | 1,066 | 1,079 | 6 | DEC | 2010 | 747 | 354,000 | 2,970 | 4.6 |
| 14 | AUG | 2020 | 123 | COMPASSVALE | BOW | #XX-25 | 1,066 | 1,070 | 10 | DEC | 2010 | 740 | 351,000 | 3,535 | 3.9 |
| 30 | JUL | 2021 | 127 | COMPASSVALE | BOW | #XX-34 | 829 | 1,204 | 7 | DEC | 2010 | 783 | 349,000 | 3,888 | 4.1 |
| 26 | MAR | 2019 | 127 | COMPASSVALE | BOW | #XX-32 | 1,001 | 1,069 | 8 | DEC | 2010 | 722 | 347,000 | 3,030 | 4.8 |
| 5 | AUG | 2020 | 127 | COMPASSVALE | BOW | #XX-32 | 1,001 | 1,079 | 11 | NOV | 2010 | 734 | 345,000 | 3,555 | 4 |
| 7 | APR | 2020 | 115 | COMPASSVALE | BOW | #XX-11 | 1,001 | 1,054 | 26 | NOV | 2010 | 711 | 343,000 | 3,420 | 4.3 |
| 12 | DEC | 2018 | 125 | COMPASSVALE | BOW | #XX-30 | 1,001 | 1,114 | 23 | NOV | 2010 | 773 | 341,000 | 2,941 | 4.6 |
| 6 | MAR | 2019 | 119 | COMPASSVALE | BOW | #XX-18 | 1,001 | 1,084 | 2 | DEC | 2010 | 745 | 339,000 | 3,016 | 4.6 |
| 3 | JAN | 2022 | 111 | COMPASSVALE | BOW | #XX-02 | 829 | 1,146 | 6 | SEP | 2011 | 738 | 338,000 | 3,772 | 4.3 |
| 12 | JUL | 2019 | 119 | COMPASSVALE | BOW | #XX-19 | 1,001 | 1,099 | 1 | DEC | 2010 | 761 | 338,000 | 3,145 | 4.4 |
| 23 | APR | 2021 | 125 | COMPASSVALE | BOW | #XX-29 | 936 | 1,132 | 27 | DEC | 2010 | 772 | 337,000 | 3,770 | 3.8 |
| 26 | NOV | 2018 | 125 | COMPASSVALE | BOW | #XX-30 | 1,001 | 1,119 | 1 | DEC | 2010 | 782 | 337,000 | 2,917 | 4.6 |
| 8 | APR | 2020 | 127 | COMPASSVALE | BOW | #XX-34 | 1,076 | 943 | 8 | DEC | 2010 | 633 | 334,000 | 3,409 | 4.4 |
| 22 | JAN | 2019 | 119 | COMPASSVALE | BOW | #XX-19 | 1,001 | 1,099 | 19 | NOV | 2010 | 765 | 334,000 | 2,986 | 4.5 |
| 21 | JUN | 2019 | 115 | COMPASSVALE | BOW | #XX-11 | 1,001 | 1,029 | 19 | NOV | 2010 | 696 | 333,000 | 3,136 | 4.7 |
| 8 | FEB | 2021 | 125 | COMPASSVALE | BOW | #XX-29 | 829 | 1,158 | 20 | DEC | 2010 | 759 | 331,000 | 3,703 | 4.3 |
| 17 | OCT | 2018 | 115 | COMPASSVALE | BOW | #XX-12 | 1,066 | 1,028 | 30 | NOV | 2010 | 717 | 331,000 | 2,878 | 4.7 |
| 18 | SEP | 2018 | 119 | COMPASSVALE | BOW | #XX-20 | 1,066 | 1,079 | 4 | NOV | 2010 | 769 | 331,000 | 2,875 | 4.4 |
| 16 | NOV | 2020 | 127 | COMPASSVALE | BOW | #XX-34 | 829 | 1,170 | 11 | NOV | 2010 | 772 | 330,000 | 3,658 | 4.2 |
| 1 | APR | 2020 | 111 | COMPASSVALE | BOW | #XX-02 | 829 | 1,146 | 10 | JAN | 2011 | 749 | 329,000 | 3,369 | 4.7 |
| 5 | APR | 2019 | 119 | COMPASSVALE | BOW | #XX-19 | 1,001 | 1,125 | 26 | NOV | 2010 | 796 | 328,888 | 3,052 | 4.2 |
| 29 | NOV | 2021 | 113 | COMPASSVALE | BOW | #XX-06 | 829 | 1,153 | 3 | AUG | 2011 | 758 | 328,000 | 3,771 | 4.2 |
| 6 | OCT | 2021 | 111 | COMPASSVALE | BOW | #XX-04 | 829 | 1,174 | 9 | MAY | 2011 | 778 | 328,000 | 3,803 | 4 |
| 2 | NOV | 2018 | 115 | COMPASSVALE | BOW | #XX-11 | 1,001 | 1,057 | 24 | NOV | 2010 | 731 | 326,000 | 2,900 | 4.7 |
| 29 | OCT | 2018 | 119 | COMPASSVALE | BOW | #XX-19 | 1,001 | 1,109 | 4 | NOV | 2010 | 784 | 325,000 | 2,916 | 4.4 |
| 9 | APR | 2021 | 113 | COMPASSVALE | BOW | #XX-05 | 829 | 1,188 | 20 | DEC | 2010 | 798 | 324,000 | 3,763 | 3.9 |
| 23 | MAR | 2021 | 113 | COMPASSVALE | BOW | #XX-05 | 829 | 1,170 | 8 | FEB | 2011 | 779 | 324,000 | 3,696 | 4.1 |
| 14 | JAN | 2021 | 111 | COMPASSVALE | BOW | #XX-02 | 829 | 1,149 | 22 | NOV | 2010 | 758 | 324,000 | 3,706 | 4.2 |
| 9 | DEC | 2020 | 113 | COMPASSVALE | BOW | #XX-06 | 829 | 1,146 | 11 | NOV | 2010 | 759 | 321,000 | 3,681 | 4.2 |
| 1 | FEB | 2019 | 115 | COMPASSVALE | BOW | #XX-11 | 1,001 | 1,027 | 8 | NOV | 2010 | 707 | 320,000 | 3,007 | 4.6 |
| 11 | MAY | 2021 | 113 | COMPASSVALE | BOW | #XX-05 | 829 | 1,138 | 12 | SEP | 2011 | 753 | 319,000 | 3,529 | 4.4 |
| 19 | MAR | 2021 | 113 | COMPASSVALE | BOW | #XX-06 | 829 | 1,158 | 21 | APR | 2011 | 775 | 318,000 | 3,620 | 4.1 |
| 1 | OCT | 2021 | 113 | COMPASSVALE | BOW | #XX-05 | 829 | 1,152 | 11 | FEB | 2011 | 770 | 317,000 | 3,885 | 3.9 |
| 13 | DEC | 2021 | 121 | COMPASSVALE | BOW | #XX-24 | 829 | 1,132 | 4 | JUL | 2011 | 753 | 314,000 | 3,815 | 4 |
| 4 | MAY | 2021 | 113 | COMPASSVALE | BOW | #XX-06 | 829 | 1,132 | 8 | AUG | 2011 | 753 | 314,000 | 3,557 | 4.3 |
| 21 | SEP | 2018 | 119 | COMPASSVALE | BOW | #XX-18 | 1,001 | 1,079 | 26 | NOV | 2010 | 765 | 314,000 | 2,856 | 4.5 |
| 14 | FEB | 2020 | 121 | COMPASSVALE | BOW | #XX-24 | 1,055 | 929 | 3 | JAN | 2011 | 633 | 312,000 | 3,329 | 4.3 |
| 19 | MAR | 2021 | 111 | COMPASSVALE | BOW | #XX-03 | 829 | 1,144 | 14 | DEC | 2010 | 769 | 311,000 | 3,748 | 3.9 |
| 6 | AUG | 2020 | 127 | COMPASSVALE | BOW | #XX-34 | 829 | 1,134 | 12 | JAN | 2011 | 764 | 307,000 | 3,494 | 4.2 |
| 21 | OCT | 2019 | 121 | COMPASSVALE | BOW | #XX-24 | 829 | 1,137 | 28 | OCT | 2011 | 767 | 306,000 | 2,915 | 5 |
| 13 | OCT | 2020 | 125 | COMPASSVALE | BOW | #XX-29 | 829 | 1,122 | 11 | FEB | 2011 | 755 | 304,000 | 3,532 | 4.2 |
| 14 | MAR | 2019 | 113 | COMPASSVALE | BOW | #XX-05 | 829 | 1,132 | 27 | DEC | 2010 | 765 | 304,000 | 2,999 | 4.9 |
| 5 | AUG | 2019 | 125 | COMPASSVALE | BOW | #XX-29 | 1,076 | 920 | 30 | DEC | 2010 | 641 | 300,000 | 3,140 | 4.3 |
| 25 | FEB | 2019 | 113 | COMPASSVALE | BOW | #XX-05 | 829 | 1,110 | 13 | APR | 2011 | 750 | 298,000 | 2,875 | 5.1 |
| 19 | SEP | 2018 | 127 | COMPASSVALE | BOW | #XX-32 | 1,001 | 1,049 | 1 | DEC | 2010 | 751 | 298,000 | 2,849 | 4.4 |
| 14 | NOV | 2019 | 111 | COMPASSVALE | BOW | #XX-01 | 829 | 1,128 | 10 | MAR | 2011 | 770 | 297,000 | 3,171 | 4.5 |
| 2 | SEP | 2019 | 127 | COMPASSVALE | BOW | #XX-34 | 829 | 1,108 | 23 | DEC | 2010 | 749 | 297,000 | 3,175 | 4.6 |
| 15 | APR | 2019 | 123 | COMPASSVALE | BOW | #XX-26 | 1,066 | 1,018 | 30 | NOV | 2010 | 739 | 297,000 | 3,058 | 3.9 |
| 31 | JUL | 2019 | 111 | COMPASSVALE | BOW | #XX-01 | 829 | 1,132 | 15 | JUN | 2011 | 779 | 292,000 | 2,968 | 4.7 |
| 26 | JUL | 2019 | 121 | COMPASSVALE | BOW | #XX-23 | 829 | 1,141 | 13 | MAY | 2011 | 789 | 292,000 | 2,996 | 4.6 |
| 4 | JAN | 2019 | 111 | COMPASSVALE | BOW | #XX-04 | 829 | 1,110 | 30 | NOV | 2010 | 758 | 292,000 | 2,957 | 4.8 |
| 26 | OCT | 2018 | 113 | COMPASSVALE | BOW | #XX-07 | 1,066 | 1,065 | 9 | NOV | 2010 | 792 | 291,000 | 2,908 | 3.8 |
| 11 | MAR | 2019 | 125 | COMPASSVALE | BOW | #XX-29 | 829 | 1,122 | 10 | NOV | 2010 | 773 | 289,000 | 3,043 | 4.6 |
| 1 | APR | 2021 | 111 | COMPASSVALE | BOW | #XX-03 | 829 | 1,147 | 10 | DEC | 2010 | 800 | 287,888 | 3,765 | 3.6 |
| 8 | OCT | 2019 | 111 | COMPASSVALE | BOW | #XX-04 | 829 | 1,132 | 31 | JAN | 2011 | 785 | 287,000 | 3,172 | 4.3 |
| 14 | MAY | 2019 | 111 | COMPASSVALE | BOW | #XX-02 | 829 | 1,144 | 15 | DEC | 2010 | 798 | 287,000 | 3,072 | 4.4 |
| 23 | APR | 2019 | 125 | COMPASSVALE | BOW | #XX-29 | 829 | 1,110 | 8 | DEC | 2010 | 764 | 287,000 | 3,058 | 4.6 |
| 30 | DEC | 2020 | 111 | COMPASSVALE | BOW | #XX-03 | 829 | 1,149 | 19 | NOV | 2010 | 804 | 286,000 | 3,694 | 3.6 |
| 15 | DEC | 2020 | 127 | COMPASSVALE | BOW | #XX-34 | 829 | 1,129 | 22 | DEC | 2010 | 787 | 284,000 | 3,646 | 3.7 |
| 20 | JUL | 2020 | 125 | COMPASSVALE | BOW | #XX-31 | 1,001 | 1,009 | 15 | DEC | 2010 | 725 | 284,000 | 3,505 | 3.5 |
| 7 | JUN | 2019 | 121 | COMPASSVALE | BOW | #XX-24 | 883 | 1,114 | 27 | DEC | 2010 | 792 | 284,000 | 3,084 | 4.1 |
| 14 | SEP | 2018 | 119 | COMPASSVALE | BOW | #XX-17 | 1,066 | 1,032 | 3 | DEC | 2010 | 766 | 284,000 | 2,842 | 3.9 |
| 2 | OCT | 2018 | 111 | COMPASSVALE | BOW | #XX-04 | 829 | 1,104 | 8 | JUN | 2011 | 764 | 282,000 | 2,673 | 5.2 |
| 19 | SEP | 2018 | 123 | COMPASSVALE | BOW | #XX-27 | 1,001 | 999 | 3 | DEC | 2010 | 717 | 282,000 | 2,847 | 4.3 |
| 12 | SEP | 2019 | 111 | COMPASSVALE | BOW | #XX-01 | 829 | 1,094 | 3 | MAY | 2011 | 755 | 281,000 | 3,054 | 4.5 |
| 3 | FEB | 2020 | 121 | COMPASSVALE | BOW | #XX-23 | 829 | 1,138 | 9 | FEB | 2011 | 802 | 278,000 | 3,281 | 4 |
| 25 | OCT | 2019 | 111 | COMPASSVALE | BOW | #XX-01 | 829 | 1,096 | 23 | MAY | 2011 | 764 | 275,000 | 3,077 | 4.4 |
| 18 | OCT | 2018 | 125 | COMPASSVALE | BOW | #XX-29 | 829 | 1,100 | 30 | NOV | 2010 | 769 | 275,000 | 2,879 | 4.7 |
| 24 | SEP | 2018 | 127 | COMPASSVALE | BOW | #XX-34 | 829 | 1,104 | 20 | DEC | 2010 | 772 | 275,000 | 2,835 | 4.7 |
| 21 | SEP | 2018 | 113 | COMPASSVALE | BOW | #XX-05 | 829 | 1,086 | 1 | JUL | 2011 | 755 | 274,000 | 2,639 | 5.1 |
| 25 | MAR | 2019 | 111 | COMPASSVALE | BOW | #XX-01 | 829 | 1,122 | 9 | NOV | 2010 | 793 | 273,000 | 3,058 | 4.2 |
| 31 | JAN | 2019 | 127 | COMPASSVALE | BOW | #XX-34 | 829 | 1,080 | 23 | DEC | 2010 | 750 | 273,000 | 2,961 | 4.6 |
| 22 | AUG | 2019 | 113 | COMPASSVALE | BOW | #XX-06 | 829 | 1,132 | 29 | DEC | 2010 | 804 | 272,000 | 3,158 | 4 |
| 25 | OCT | 2019 | 111 | COMPASSVALE | BOW | #XX-04 | 829 | 1,116 | 28 | JAN | 2011 | 789 | 271,000 | 3,192 | 4 |
| 20 | SEP | 2018 | 121 | COMPASSVALE | BOW | #XX-23 | 829 | 1,086 | 26 | NOV | 2010 | 759 | 271,000 | 2,855 | 4.7 |
| 3 | JAN | 2020 | 121 | COMPASSVALE | BOW | #XX-24 | 829 | 1,146 | 3 | JUN | 2011 | 820 | 270,000 | 3,136 | 4 |
| 15 | NOV | 2018 | 111 | COMPASSVALE | BOW | #XX-02 | 829 | 1,104 | 28 | DEC | 2010 | 778 | 270,000 | 2,879 | 4.5 |
| 20 | JUN | 2019 | 121 | COMPASSVALE | BOW | #XX-23 | 829 | 1,132 | 14 | DEC | 2010 | 808 | 268,000 | 3,110 | 4 |
| 25 | SEP | 2018 | 111 | COMPASSVALE | BOW | #XX-02 | 829 | 1,087 | 14 | DEC | 2010 | 764 | 268,000 | 2,842 | 4.6 |
| 24 | SEP | 2018 | 111 | COMPASSVALE | BOW | #XX-02 | 829 | 1,098 | 10 | JAN | 2011 | 775 | 268,000 | 2,814 | 4.6 |
| 17 | DEC | 2019 | 121 | COMPASSVALE | BOW | #XX-23 | 829 | 1,086 | 22 | NOV | 2010 | 764 | 267,000 | 3,312 | 4 |
| 3 | APR | 2019 | 121 | COMPASSVALE | BOW | #XX-23 | 829 | 1,068 | 9 | MAY | 2011 | 746 | 267,000 | 2,886 | 4.6 |
| 2 | OCT | 2018 | 111 | COMPASSVALE | BOW | #XX-01 | 829 | 1,116 | 15 | FEB | 2011 | 794 | 267,000 | 2,786 | 4.6 |
| 14 | OCT | 2019 | 121 | COMPASSVALE | BOW | #XX-24 | 829 | 1,074 | 8 | AUG | 2011 | 758 | 262,000 | 2,989 | 4.3 |
| 11 | JAN | 2019 | 127 | COMPASSVALE | BOW | #XX-34 | 936 | 1,041 | 14 | DEC | 2010 | 766 | 258,000 | 2,950 | 3.9 |
| 16 | OCT | 2018 | 113 | COMPASSVALE | BOW | #XX-06 | 829 | 1,062 | 7 | JAN | 2011 | 750 | 258,000 | 2,839 | 4.6 |
| 3 | OCT | 2019 | 111 | COMPASSVALE | BOW | #XX-01 | 829 | 1,068 | 25 | OCT | 2011 | 758 | 257,000 | 2,900 | 4.4 |
| 21 | SEP | 2018 | 111 | COMPASSVALE | BOW | #XX-02 | 829 | 1,098 | 1 | DEC | 2010 | 788 | 257,000 | 2,851 | 4.3 |
| 21 | JUN | 2019 | 111 | COMPASSVALE | BOW | #XX-01 | 829 | 1,071 | 20 | JUN | 2011 | 763 | 256,000 | 2,923 | 4.3 |
| 17 | APR | 2019 | 111 | COMPASSVALE | BOW | #XX-03 | 829 | 1,122 | 17 | DEC | 2010 | 813 | 256,000 | 3,043 | 3.9 |
| 15 | NOV | 2018 | 113 | COMPASSVALE | BOW | #XX-05 | 829 | 1,110 | 8 | SEP | 2011 | 801 | 256,000 | 2,625 | 4.6 |
| 24 | APR | 2019 | 123 | COMPASSVALE | BOW | #XX-28 | 1,066 | 1,126 | 16 | JUL | 2013 | 891 | 250,000 | 2,108 | 4.1 |
| 12 | SEP | 2018 | 121 | COMPASSVALE | BOW | #XX-23 | 829 | 1,122 | 28 | JUN | 2011 | 820 | 250,000 | 2,633 | 4.4 |
| 4 | MAY | 2021 | 113 | COMPASSVALE | BOW | #XX-08 | 1,066 | 1,218 | 9 | APR | 2018 | 985 | 248,000 | 1,121 | 7.1 |
| 21 | DEC | 2018 | 111 | COMPASSVALE | BOW | #XX-03 | 883 | 1,065 | 15 | DEC | 2010 | 787 | 245,000 | 2,928 | 3.8 |
| 11 | OCT | 2018 | 113 | COMPASSVALE | BOW | #XX-05 | 883 | 1,054 | 30 | NOV | 2010 | 776 | 245,000 | 2,872 | 4 |
| 14 | MAY | 2021 | 127 | COMPASSVALE | BOW | #XX-32 | 1,001 | 1,199 | 28 | MAR | 2014 | 959 | 240,000 | 2,604 | 3.2 |
| 8 | OCT | 2018 | 121 | COMPASSVALE | BOW | #XX-23 | 829 | 1,041 | 29 | JUN | 2011 | 753 | 239,000 | 2,658 | 4.6 |
| 15 | OCT | 2018 | 111 | COMPASSVALE | BOW | #XX-01 | 829 | 1,062 | 8 | AUG | 2011 | 775 | 238,000 | 2,625 | 4.5 |
| 18 | SEP | 2018 | 113 | COMPASSVALE | BOW | #XX-05 | 829 | 1,032 | 18 | MAR | 2011 | 746 | 237,000 | 2,741 | 4.4 |
| 5 | NOV | 2018 | 111 | COMPASSVALE | BOW | #XX-04 | 883 | 1,031 | 15 | DEC | 2010 | 765 | 235,000 | 2,882 | 3.9 |
| 24 | SEP | 2018 | 127 | COMPASSVALE | BOW | #XX-34 | 829 | 1,072 | 9 | FEB | 2011 | 790 | 233,888 | 2,784 | 4.1 |
| 8 | FEB | 2022 | 117 | COMPASSVALE | BOW | #XX-16 | 1,830 | 1,121 | 10 | OCT | 2018 | 994 | 232,888 | 1,217 | 3.7 |
| 3 | JAN | 2019 | 111 | COMPASSVALE | BOW | #XX-04 | 829 | 1,050 | 13 | SEP | 2012 | 772 | 230,000 | 2,303 | 5 |
| 20 | NOV | 2018 | 113 | COMPASSVALE | BOW | #XX-05 | 829 | 1,062 | 3 | JAN | 2011 | 793 | 223,000 | 2,878 | 3.8 |
| 18 | FEB | 2019 | 121 | COMPASSVALE | BOW | #XX-24 | 829 | 1,013 | 7 | SEP | 2011 | 748 | 220,000 | 2,721 | 4.2 |
| 6 | MAR | 2018 | 115 | COMPASSVALE | BOW | #XX-10 | 1,066 | 962 | 22 | DEC | 2010 | 756 | 219,000 | 2,631 | 3.4 |
| 25 | SEP | 2018 | 127 | COMPASSVALE | BOW | #XX-34 | 829 | 1,055 | 17 | DEC | 2010 | 798 | 213,800 | 2,839 | 3.7 |
| 25 | SEP | 2018 | 113 | COMPASSVALE | BOW | #XX-05 | 829 | 1,026 | 3 | DEC | 2010 | 769 | 213,000 | 2,853 | 3.8 |
| 25 | SEP | 2018 | 111 | COMPASSVALE | BOW | #XX-03 | 829 | 1,076 | 20 | SEP | 2012 | 825 | 208,000 | 2,196 | 4.5 |
| 9 | APR | 2018 | 113 | COMPASSVALE | BOW | #XX-08 | 1,066 | 985 | 5 | JAN | 2011 | 792 | 206,000 | 2,651 | 3.1 |
| 17 | FEB | 2022 | 125 | COMPASSVALE | BOW | #XX-30 | 1,001 | 1,317 | 12 | DEC | 2018 | 1,114 | 203,000 | 1,163 | 5.4 |
| 24 | SEP | 2018 | 125 | COMPASSVALE | BOW | #XX-29 | 829 | 1,011 | 30 | NOV | 2010 | 804 | 172,000 | 2,855 | 3 |
| 9 | FEB | 2018 | 125 | COMPASSVALE | BOW | #XX-29 | 829 | 953 | 9 | DEC | 2010 | 754 | 165,000 | 2,619 | 3.3 |
| 11 | JAN | 2018 | 123 | COMPASSVALE | BOW | #XX-27 | 1,001 | 879 | 6 | DEC | 2010 | 718 | 161,000 | 2,593 | 2.9 |
| 17 | MAR | 2017 | 127 | COMPASSVALE | BOW | #XX-33 | 1,001 | 937 | 7 | DEC | 2010 | 781 | 156,000 | 2,292 | 2.9 |
| 23 | OCT | 2018 | 111 | COMPASSVALE | BOW | #XX-02 | 829 | 1,035 | 17 | JUL | 2013 | 864 | 142,000 | 1,924 | 3.5 |
| 28 | JAN | 2022 | 127 | COMPASSVALE | BOW | #XX-34 | 829 | 1,289 | 28 | NOV | 2018 | 1,128 | 133,000 | 1,157 | 4.3 |
| 1 | OCT | 2018 | 121 | COMPASSVALE | BOW | #XX-24 | 829 | 1,092 | 20 | SEP | 2013 | 941 | 125,000 | 1,837 | 3 |
| 13 | OCT | 2017 | 111 | COMPASSVALE | BOW | #XX-04 | 829 | 911 | 27 | FEB | 2012 | 772 | 115,000 | 2,055 | 3 |
| 12 | JUL | 2017 | 117 | COMPASSVALE | BOW | #XX-13 | 1,163 | 830 | 25 | NOV | 2010 | 804 | 30,000 | 2,421 | 0.5 |
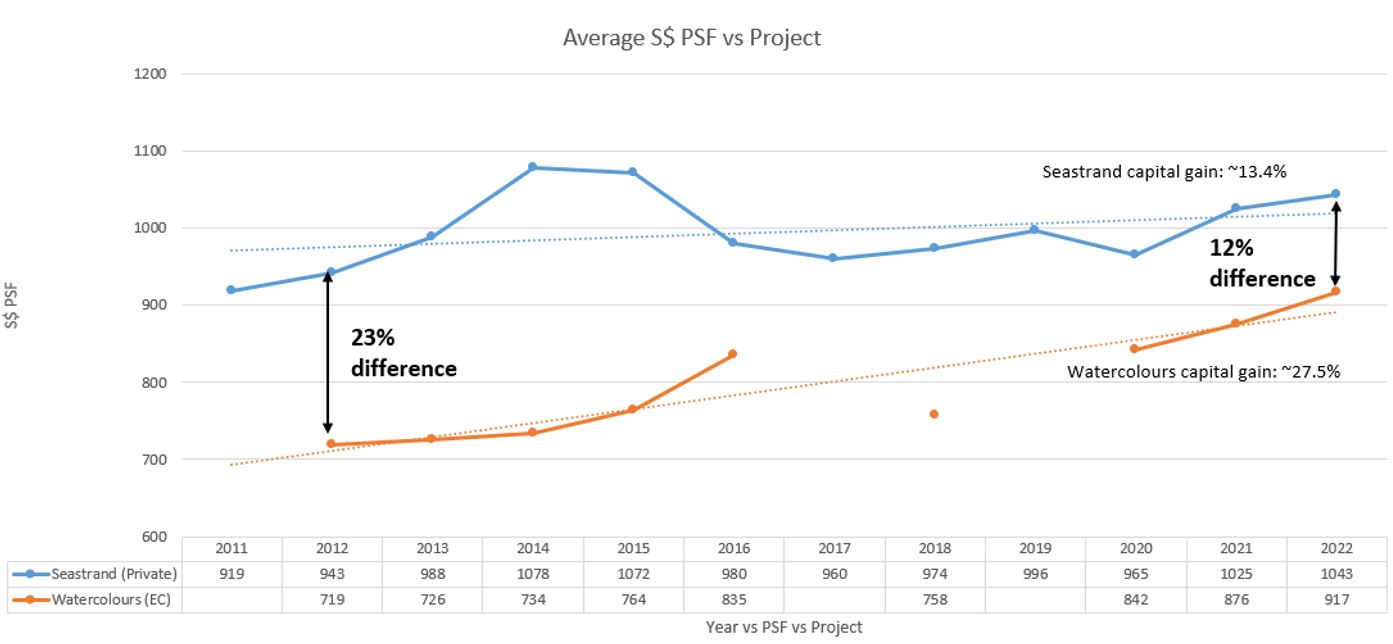
Case Study: Watercolour (EC) vs Seastrand (Private)
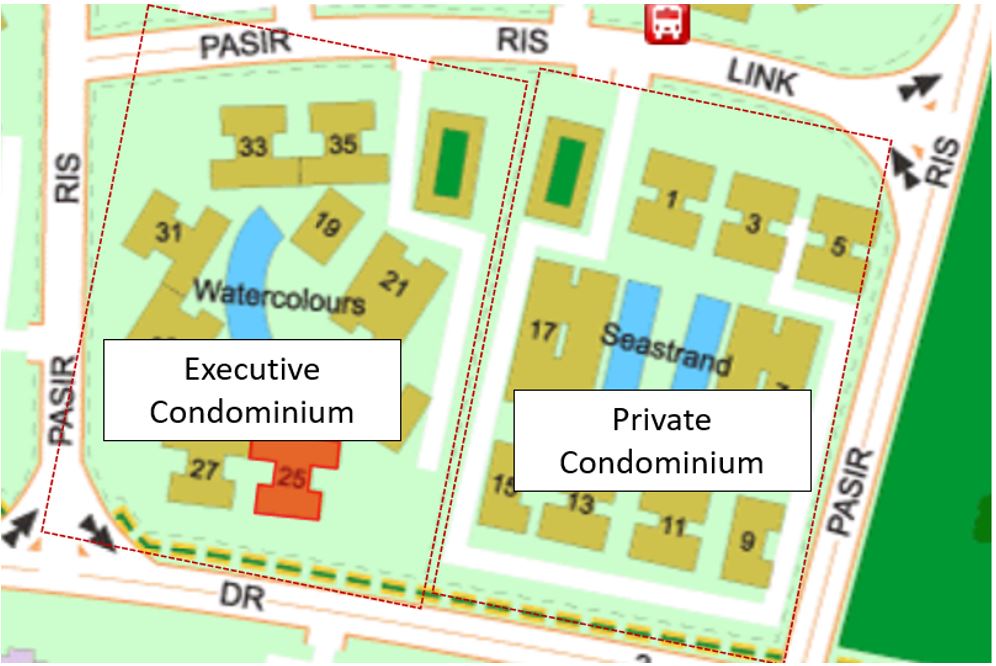
With a lower launch price for Watercolour of about 23% difference, buyers already have the initial price advantage. Once the executive condominium is partially privatized, the price difference of both condominiums has narrowed. In terms of price appreciation, it would be easy to have higher capital gain for Watercolour (23%) compared to Seastrand (13.4%).
(Click on the above graph to enlarge it)
With a closer look at the individual transaction, the top 10 profitable transactions easily exceed 190k in profits.
| SOLD ON | ADDRESS | UNIT AREA (SQFT) | SALE PRICE (S$ PSF) | BOUGHT ON | PURCHASE PRICE (S$ PSF) | PROFIT (S$) | HOLDING PERIOD (DAYS) | ANNUALISED (%) | ||||||||
|---|---|---|---|---|---|---|---|---|---|---|---|---|---|---|---|---|
| 13 | SEP | 2021 | 23 | PASIR | RIS | LINK | #XX-09 | 2,282 | 749 | 6 | DEC | 2012 | 624 | 286,800 | 3,203 | 2.1 |
| 31 | AUG | 2021 | 27 | PASIR | RIS | LINK | #XX-16 | 1,281 | 937 | 9 | JUL | 2012 | 723 | 273,800 | 3,340 | 2.9 |
| 25 | OCT | 2021 | 25 | PASIR | RIS | LINK | #XX-14 | 1,733 | 791 | 25 | SEP | 2013 | 647 | 249,200 | 2,952 | 2.5 |
| 16 | SEP | 2021 | 23 | PASIR | RIS | LINK | #XX-09 | 1,378 | 864 | 11 | DEC | 2012 | 683 | 248,900 | 3,201 | 2.7 |
| 20 | JAN | 2022 | 35 | PASIR | RIS | LINK | #XX-36 | 1,335 | 847 | 17 | AUG | 2012 | 687 | 213,300 | 3,443 | 2.2 |
| 14 | JUN | 2021 | 35 | PASIR | RIS | LINK | #XX-36 | 1,281 | 881 | 16 | AUG | 2012 | 727 | 197,688 | 3,224 | 2.2 |
| 24 | JUN | 2021 | 35 | PASIR | RIS | LINK | #XX-35 | 958 | 939 | 20 | JUL | 2012 | 734 | 197,100 | 3,261 | 2.8 |
| 1 | NOV | 2021 | 29 | PASIR | RIS | LINK | #XX-22 | 861 | 894 | 6 | JUL | 2012 | 666 | 196,500 | 3,405 | 3.2 |
| 11 | OCT | 2021 | 23 | PASIR | RIS | LINK | #XX-10 | 990 | 879 | 2 | JUL | 2013 | 684 | 192,800 | 3,023 | 3.1 |
| 22 | OCT | 2021 | 27 | PASIR | RIS | LINK | #XX-15 | 990 | 868 | 21 | NOV | 2013 | 676 | 190,900 | 2,892 | 3.2 |
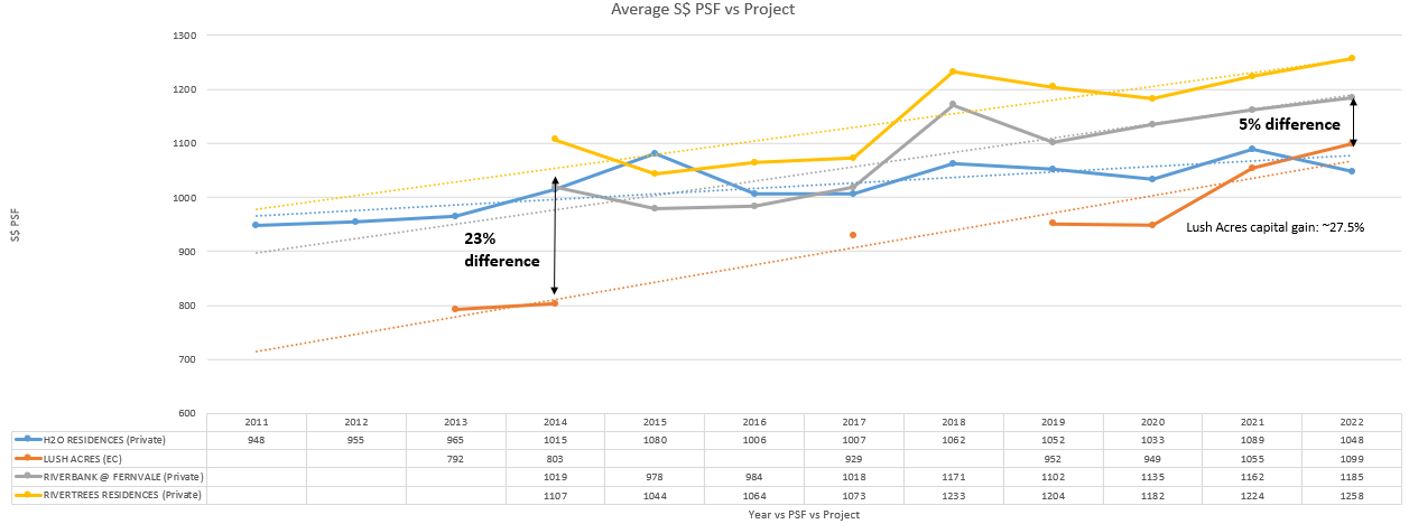
Case Study: Lush Acre (EC) vs Riverbank @ Fernvale, Rivertrees Residences and H20 Residences (Private)
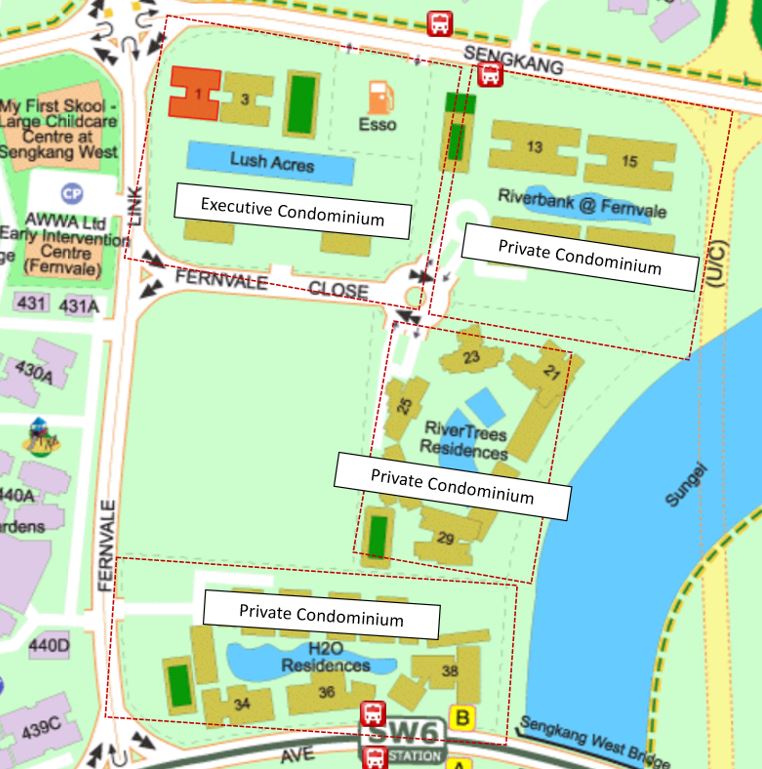
Launched in the year 2013, Lush Acres was developed by a local reputable developer – City Developments Limited (CDL). Aside from the typical condominium facilities and features, it boasts a rare 100m lap pool.
H20 Residences, Lush Acres, Riverbank @ Fernvale, Rivertrees Residences are launched in the year 2011 to 2014. As Lush Acres was launched as an executive condominium, owners immediately enjoy a price discount of 23% relative to its private condominium.
The price differences narrowed to around 5% relative to its neighbouring private condominiums after Lush Acres reached its MOP. In terms of price appreciation, owners have around 27.5% capital gain.
(Click on the above graph to enlarge it.)
Looking at the top 10 profitable transactions, the actual profits exceed 400k per transaction. The 2 most profitable transactions net the owners over half a million dollars in profits!
| SOLD ON | ADDRESS | UNIT AREA (SQFT) | SALE PRICE (S$ PSF) | BOUGHT ON | PURCHASE PRICE (S$ PSF) | PROFIT (S$) | HOLDING PERIOD (DAYS) | ANNUALISED (%) | |||||||
|---|---|---|---|---|---|---|---|---|---|---|---|---|---|---|---|
| 9 | DEC | 2021 | 7 | FERNVALE | CLOSE | #XX-16 | 1,507 | 1,188 | 10 | FEB | 2014 | 803 | 579,600 | 2,859 | 5.1 |
| 9 | DEC | 2021 | 7 | FERNVALE | CLOSE | #XX-16 | 1,507 | 1,175 | 25 | NOV | 2013 | 801 | 563,600 | 2,936 | 4.9 |
| 13 | AUG | 2021 | 7 | FERNVALE | CLOSE | #XX-16 | 1,507 | 1,121 | 12 | FEB | 2014 | 794 | 491,708 | 2,739 | 4.7 |
| 17 | DEC | 2021 | 1 | FERNVALE | CLOSE | #XX-01 | 1,238 | 1,204 | 1 | NOV | 2013 | 812 | 484,290 | 2,968 | 5 |
| 10 | NOV | 2021 | 3 | FERNVALE | CLOSE | #XX-08 | 1,238 | 1,171 | 25 | NOV | 2013 | 790 | 472,400 | 2,907 | 5.1 |
| 10 | NOV | 2021 | 1 | FERNVALE | CLOSE | #XX-01 | 1,238 | 1,175 | 11 | NOV | 2013 | 798 | 467,610 | 2,921 | 5 |
| 31 | AUG | 2021 | 5 | FERNVALE | CLOSE | #XX-12 | 1,302 | 1,152 | 26 | NOV | 2013 | 795 | 464,950 | 2,835 | 4.9 |
| 5 | AUG | 2021 | 7 | FERNVALE | CLOSE | #XX-16 | 1,507 | 1,115 | 23 | SEP | 2013 | 819 | 445,600 | 2,873 | 4 |
| 4 | OCT | 2021 | 1 | FERNVALE | CLOSE | #XX-01 | 1,238 | 1,123 | 17 | SEP | 2013 | 766 | 441,200 | 2,939 | 4.9 |
| 16 | SEP | 2021 | 3 | FERNVALE | CLOSE | #XX-08 | 1,238 | 1,131 | 23 | SEP | 2013 | 775 | 440,800 | 2,915 | 4.8 |
Consideration when buying Executive Condominium new launch
Eligibility
Before committing to a new launch EC purchase, there are several criteria to be met
- Family Nucleus
- Public Scheme
- Fiancé/Fiancée Scheme
- Orphans Scheme
- Joint Singles Scheme
- Citizenship
- You must be a Singapore Citizen
- At least 1 other applicant must be a Singapore Citizen or Singapore Permanent Resident
- All singles must be Singapore Citizens if applying under the Joint Singles Scheme
- Age
- At least 21 years old
- At least 35 years old, if applying under the Joint Singles Scheme
- Income Ceiling
- Your household income must not exceed the $16,000 income ceiling.
- Property Ownership
- You do not own other property overseas or locally, or have not disposed of any within the last 30 months
- You have not bought a new HDB/ DBSS flat or EC, or received a CPF Housing Grant before; or, have only bought 1 of these properties/ received 1 CPF Housing Grant thus far
For first-timer families, there is 70% of flat supply is set aside during the initial launch period (1 month). The remaining 30% of flat supply is set for second-timer families.
Housing Loan
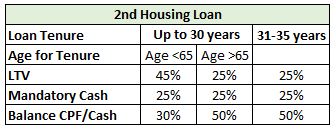
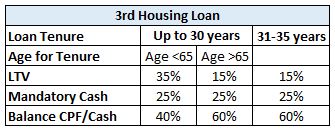
Executive Condominium is still bound by Mortgage Servicing Ratio (MSR) of 30% of assessable income.
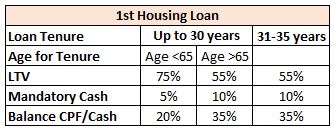
For EC direct purchase from developers, the Loan-To-Value (LTV) will be as per 1st Housing Loan
Stamp Duty
Buyer Stamp Duty will apply on the purchase of Executive Condominium.
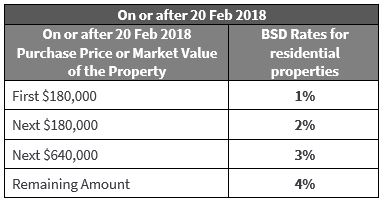
For HDB Upgraders, owners do not need to pay ABSD when they purchase EC directly from the developer. Buyers do not need to submit a separate application to IRAS or HDB for the remission of ABSD.
CPF Housing Grant
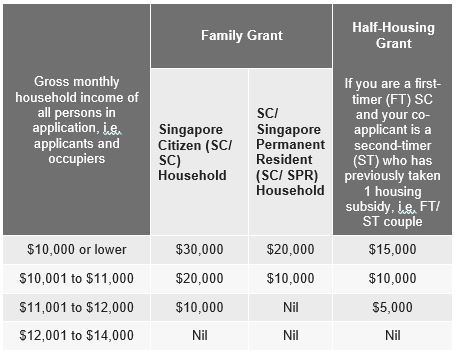
Depending on the applicants’ gross monthly income, there are up to $30,000 CPF housing grants to offset the cash component of the initial down-payment.
Ownership
If the applicants are currently staying in an HDB flat, there is no requirement to sell HDB once the purchase of the executive condominium is completed. The HDB flat is required to be disposed of within 6 months of taking possession of the EC unit.
Consideration when buying resale Executive Condominium
Buying a resale executive condominium is usually with less restriction. There is no family nucleus requirement. Depending on the status of the resale executive condominium, it would be only available for Singaporean citizens or Permanent residents if it’s less than 10 years of MOP. Otherwise, there is no difference in legal status compared to a private condominium.
Eligibility
Executive condominium (EC) is subjected to a Minimum Occupation Period (MOP) of 5 years before it can be sold on the secondary market. Upon fulfilling the MOP, it can be sold to Singaporean citizens (SC) or Singapore Permanent Residents (SPR). It is considered as partially privatized until it reached at least 10 years of the occupation period.
For fully privatized condominiums, there is no restriction on citizenship, and it can be sold to foreigners as well. There is no other restriction on age, income ceiling or property ownership. At this point in time, the potential buyers’ pool is expanded from a local market to an international market.
Housing Loan
For housing loan applications, there is no Mortgage Servicing Ratio (MSR) applied when buying resale EC. The eligible loan amount will be calculated based on the Total Debt Servicing Ratio (TDSR) framework. This is currently at 55% of assessable income.
Regardless of partially or fully privatized status, resale EC is considered a private property and the only way to secure a loan is via the private bank. The maximum loan to valuation is currently at 75%.
Stamp Duty
Aside from the Buyer Stamp Duty, there is Additional Buyer Stamp Duty (ABDS) to consider and it varies on your citizenship.
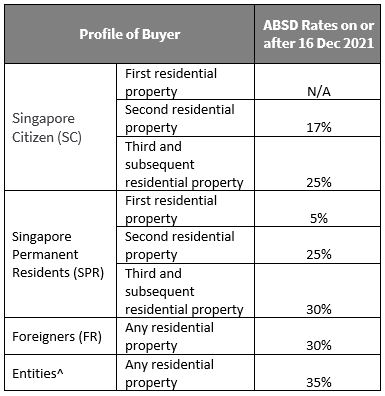
^An unincorporated association,
- A trustee for a collective investment scheme when acting in that capacity,
- A trustee-manager for a business trust when acting in that capacity
- The partners of the partnership whether or not any of them is an individual, where the property conveyed, transferred or assigned is to be held as partnership property.
- Plus Additional 5% for Housing Developers (non-remittable)
Future trend for Executive Condominium
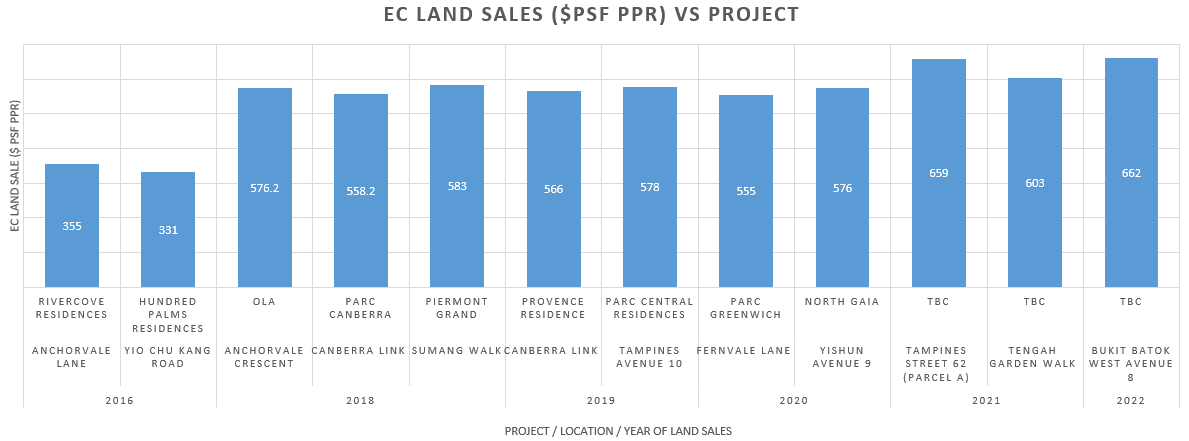
The land sales for the executive condominium has seen an upwards trajectory in the land bid price, which is in tandem with Singapore residential market. As observed in the recent land in Bukit Batok West Avenue 8, the land bid is currently at an all-time high of $662 per square foot per plot ratio (PSF PPR). Eventually, this would push up the expected new launch EC price.
*TBC: To be confirmed. Also, you can click on the graph above to enlarge it.
Despite the expected increase in the new launch price, the executive condominiums will still be priced at a discount relative to private condominiums.
For those who can recall, Hundred Palms Residences was sold out during the first day of launch (Hougang EC sells out within hours of launch | The Straits Times). With the initial price advantage, it would make financial sense to get a new launch executive if one is eligible for it.
Summary
Executive condominium represents an excellent buying opportunity for Singaporeans and PR who are eligible. As summary,
New Executive Condominium
- For Singaporeans ONLY
- Facilities similar to Private Condominiums
- Entry Price 15-30% Lower than Private
- Privatized after 5 years (Can sell to SC & SPR, 10 years to Foreigners)
Partially privatized resale Executive Condominium ( 5 < age < 10 years)
- For Singaporean and Permanent Residents
- Family nucleus not required
- The bank loan is subjected to TDSR, not subjected to MSR
Fully privatized resale Executive Condominium (age > 10years)
- No restriction on the citizenship
If you are thinking about it, why not take a look at the upcoming North Gaia executive condominium launch in Yishun?
Take action today, reach out to Mark Lim if you like to be the next proud owner of the upcoming EC!
🚀 Stay Ahead in the Property Market!
Be the first to receive exclusive updates, launch reviews, insider deals, and real-time alerts — directly on your preferred app.
👉 Join our community now:
🌐 Spread Knowledge. Share with Others.
Click any of the icons below to share this content with those who may benefit from it.

Mark Lim
Decisions are best made with reliable data. With his passion for numbers and data, Mark strives to provide insights to his clients and reader to make better decisions. If you are looking just for advice, he will always be available. Talk to Mark today!

